Driving Under the Influence
Psychoactive substances, including cannabis, can affect the ability to carry out normal functions by altering perceptions, judgement, short-term memory, and cognitive abilities. Thus, it is illegal in many settings such as driving, to be under the influence of cannabis. Cannabis use has been associated with impairment of psychomotor and cognitive functions while driving, which increases the risk of crashes (Azofeifa, 2019).
National Prevalence of DUI Cannabis
In 2023, 12.1 million (4.6%) people aged 16+ in the US drove under the influence of cannabis in the past year (NSDUH).
In 2023, young adults aged 21-25 years (8.9%) had the highest prevalence of driving under the influence of cannabis in the past year compared to those underaged 16-20 years (6.2%) and adults aged 26+ (4.0%) in the US (Figure 1).
In 2023, among those aged 16+ in the US, males (6.1%) drove under the influence of cannabis at a rate that was nearly double that of females (3.1%) (Figure 2).
In 2023, American Indian/Alaskan Natives (AIAN, 7.7%) had the highest prevalence of driving under the influence of cannabis in the past year compared to other race/ethnic groups, while Asians (1.3%) had the lowest (Figure 3).
In 2023 in the US, the prevalence of driving under the influence in the past year was highest among those who were between 100-199% of the federal poverty level (5.3%), followed by those who were 200% or more over the federal poverty level (4.7%), and then those less than 100% federal poverty level (4.3%) (Figure 4).
Prevalence of DUI Cannabis in LAC
Drivers Under the Influence of Cannabis
In 2022, among LAC residents who ever used cannabis, over one third (35.6%) reported having ever driven a car while under the influence of cannabis.
In 2022 in LAC, ever users that drove under the influence of cannabis increased with age from 13.5% among youth aged 12-17 years, peaking at 39.1% among those aged 21-29, then decreased slightly to 38.3% among those aged 30+ years (Figure 5).
In 2022 in LAC, male ever users (44.8%) were more likely to have ever driven a car while under the influence of cannabis than female ever users of cannabis (25.6%) (Figure 6).
In 2022 in LAC, ever users who were Black (45.6%) were most likely to have ever driven under the influence of cannabis, followed by AIAN (42.0%), Whites (38.3%), Latinxs (34.7%), those who were multi-race/ethnicity (34.6%), and then Asians (17.7%) (Figure 7).
Passengers of DUI Drivers
In 2022 in LAC, 29.1% of people aged 12+ reported having been a passenger in a car when the driver was driving under the influence of cannabis.
In 2022 in LAC, cannabis users (58.0%) were more likely to have been a passenger in a car when the driver was driving under the influence of cannabis than non-users (12.5%) (Figure 8).
In 2022 in LAC, among cannabis ever users, the majority of adults aged 21+ had ever been a passenger when the driver was under the influence of cannabis, while 47.2% of youth aged 12-17 , and 33.1% of those underaged 18-20 reported ever being a passenger.
Among non-users, those aged 21-29 (19.6%) and aged 18-20 (19.2%) were most likely to have been a passenger of a driver who was driving under the influence of cannabis (Figure 9).
In LAC in 2022, male users (64.3%) were much more likely than female non-users (11.9%) to have been a passenger of a driver who was under the influence of cannabis (Figure 10).
In LAC in 2022, users who were American Indian/Alaska Native (65.3%), White (64.8%), and Black (64.7%) were most likely to have been a passenger when the driver was under the influence of cannabis, followed by Latinxs (57.0%), multi-race/ethnicity (55.8%), then Asians (37.4%).
Among non-users, American Indian/Alaska Native (32.2%) were the most likely to have ever been a passenger when the driver was driving under the influence of cannabis, followed by Blacks (22.6%), those who were multi-race/ethnicity (17.3%), White (16.3%) Latinx (11.9%), then Asians (7.8%) (Figure 11).
Fatal Collisions from DUI Cannabis in LAC
Cannabis has been the second (after alcohol) most frequently found substance among drivers of fatal traffic accidents (FARS).
In LAC, from 2001 to 2022, there were 1,467 fatal traffic collisions in which at least one driver tested positive for cannabis (cannabis-involved), accounting for 29.4% of fatal collisions in which at least one driver tested positive for alcohol or drugs (AOD-involved; N=4,988), and 9.9% of all fatal collisions (N=14,796). The number of fatal collisions involving cannabis increased 938% from 13 in 2001 to 135 in 2020.
There were 1,647 fatalities from cannabis-involved fatal traffic collisions, accounting for 29.8% of AOD-involved fatalities from fatal collisions (N=5,536), and 10.4% of all fatalities from fatal collisions (N=15,811). The number of fatalities from fatal collisions involving cannabis increased 831% from 16 in 2001 to 149 in 2020 (Figure 12).
(Notes: Clear legal THC limits have not been established to determine sobriety since THC concentration of the blood or other specimens and the actual levels of impairment can vary based on dosage, individual cannabis tolerance, and other factors.
Data for 2021 and 2022 are preliminary and may undercount the number of cannabis-involved fatal collisions and fatalities for those years.)
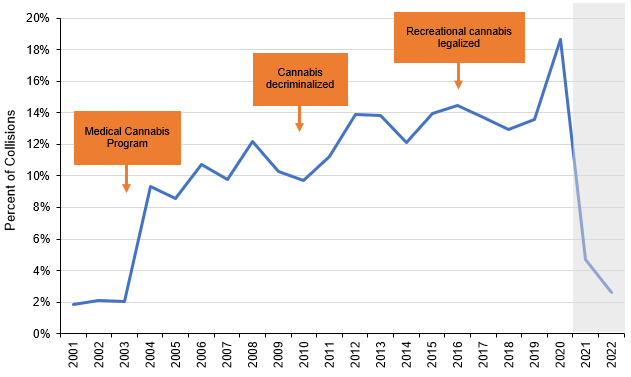
The proportion of all fatal collisions that involved cannabis increased from 2% in 2001 to 19% in 2020 (Note: percentages for 2021 and 2022 are preliminary and subject to change).
Increases in fatal collisions involving cannabis co-occurred with the passage of the Compassionate Use Act which initiated the Medical Marijuana Program, and the decriminalization of cannabis which reduced the penalty for possession of <1oz from a misdemeanor to an infraction (Figure 13).
Figure 13. Percent of all fatal collisions that involved cannabis, LAC
Source: FARS
DUI Cannabis Drivers in Fatal Collisions in LAC
From 2001 to 2022, there were 1,480 drivers in fatal traffic collisions in LAC who tested positive for cannabis, of which 1,201 died (FARS).
(Note: Data for 2021 and 2022 are preliminary and subject to change)
From 2001-2022, among drivers involved in fatal collisions in LAC who also tested positive for cannabis, over half (55%, N=816) were aged 21-34 years (Figure 14).
(Note: Data for 2021 and 2022 are preliminary and subject to change)
From 2001-2022, drivers in fatal collisions in LAC who tested positive for cannabis were predominately male (88%, N=1,299) (Figure 15).
(Note: Data for 2021 and 2022 are preliminary and subject to change)
From 2001-2022, among drivers in fatal collisions in LAC who tested positive for cannabis, Latinxs (41%) and Whites (37%) accounted for the largest race/ethnic groups, followed by Blacks (18%) and Asian/Pacific Islanders (API, 2%) (Figure 16).
(Note: Race/ethnicity information available from death certificates. Data for 2021 and 2022 are preliminary and subject to change)
From 2001-2022, among drivers in fatal collisions in LAC who tested positive for cannabis, 42% were positive for cannabis alone, 30% were positive for both cannabis and alcohol (BAC > 0.08), 17% were positive for both cannabis and other drugs, and 11% were positive for a combination of cannabis, alcohol, and other drugs (Figure 17).
(Note: Data for 2021 and 2022 are preliminary and subject to change)
References
Azofeifa, A., Rexach-Guzmán, B. D., Hagemeyer, A. N., Rudd, R. A., & Sauber-Schatz, E. K. (2019). Driving Under the Influence of Marijuana and Illicit Drugs Among Persons Aged ≥16 Years – United States, 2018. MMWR. Morbidity and mortality weekly report, 68(50), 1153–1157. https://doi.org/10.15585/mmwr.mm6850a1
Center for Behavioral Health Statistics and Quality. (2024). Results from the 2023 National Survey on Drug Use and Health (NSDUH): Detailed tables. Substance Abuse and Mental Health Services Administration. https://www.samhsa.gov/data/report/2023-nsduh-detailed-tables. Tables 8.34B and 8.35B.
Marijuana Use and Public Perceptions in Los Angeles County: Findings from the 2022 Community Needs Assessment (CNA). Health Outcomes and Data Analytics, Substance Abuse Prevention and Control, Los Angeles County Department of Public Health, April 2024. http://publichealth.lacounty.gov/sapc/MDU/SpecialReport/Marijuana-Use-and-Public-Perceptions-in-Los-Angeles-County.pdf. Retrieved 4/17/2024
National Highway Traffic Safety Administration (NHTSA) Fatality Analysis Reporting System (FARS). https://www.nhtsa.gov/research-data/fatality-analysis-reporting-system-fars. Data as of 5/24/2024.