
Marijuana use is not harmless, and overdose is possible. Marijuana may cause anxiety, paranoia, delusions or hallucinations, rapid heart rate, increased blood pressure, and severe nausea or vomiting. Some forms of marijuana use have a greater potential for poisoning due to the varying effects they can have on the body compared to smoking marijuana. Edibles and drinks infused with marijuana often contain unknown amounts of tetrahydrocannabinol (THC), can produce delayed effects, or have intoxicating effects that take longer than expected (CDC, 2021).
Those who experience potential cannabis poisoning or other poisoning should seek help by calling the 24/7 National Poison Control Hotline at (800) 222-1222, or visiting webPOISONCONTROL. Both options provide free, expert, and confidential guidance in a poison emergency. Calls will be routed to the local Poison Center, and will be managed by a Poison Specialist (registered nurse or pharmacist) who will determine the severity of your case and provide recommendations.
Marijuana use is not harmless, and overdose is possible. Marijuana may cause anxiety, paranoia, delusions or hallucinations, rapid heart rate, increased blood pressure, and severe nausea or vomiting. Some forms of marijuana use have a greater potential for poisoning due to the varying effects they can have on the body compared to smoking marijuana. Edibles and drinks infused with marijuana often contain unknown amounts of tetrahydrocannabinol (THC), can produce delayed effects, or have intoxicating effects that take longer than expected (CDC, 2021).
Lorem ipsum dolor sit amet, consectetur adipiscing elit. Ut elit tellus, luctus nec ullamcorper mattis, pulvinar dapibus leo.
In the US, the number of drug overdose deaths has been increasing dramatically over the last two decades. The number of drug overdose deaths in 2021 was nearly 5 times that in 1999. Since 2009, drug overdoses has been the leading cause of injury deaths, surpassing the number of deaths by both motor vehicle crashes and firearms. It’s widely recognized that opioids were driving the national drug overdose epidemic with consistent increases in opioid overdose deaths, and particularly sharp increases in the last couple of years. In the US, opioid overdose deaths increased 61% from 2019 to 2021, and increased 17% from 2020 to 2021 (Figure 1).
In Los Angeles County (LAC), increases in drug overdose deaths in LAC were observed starting in 2015, and were also particularly steep in the last couple of years (Figure 1). Compared to 2021, opioid overdose deaths increased by 125% from 2019, and by 20% from 2020 (Figure 1).
(Note: Based on death certificate data. For local opioid- and fentanyl-related death data from the Coroner’s Office, please see Figures 4-6).
In the US, the rise in opioid overdose deaths can be outlined in three distinct waves (Figures 2-3):
California followed a similar pattern as the overall US with a slight lag. In LAC, the number of synthetic opioid deaths sharply increased from 2015 through 2021, driving the increase in opioid deaths (Figures 2-3).
According to LAC Coroner’s data, opioid deaths were relatively stable from 2010-2015, then began increasing in 2016. By 2021, there were 1,719 opioid deaths, a 10.9% increase from the previous year in 2020, and a 104% increase from the year before in 2019 (Figure 4).
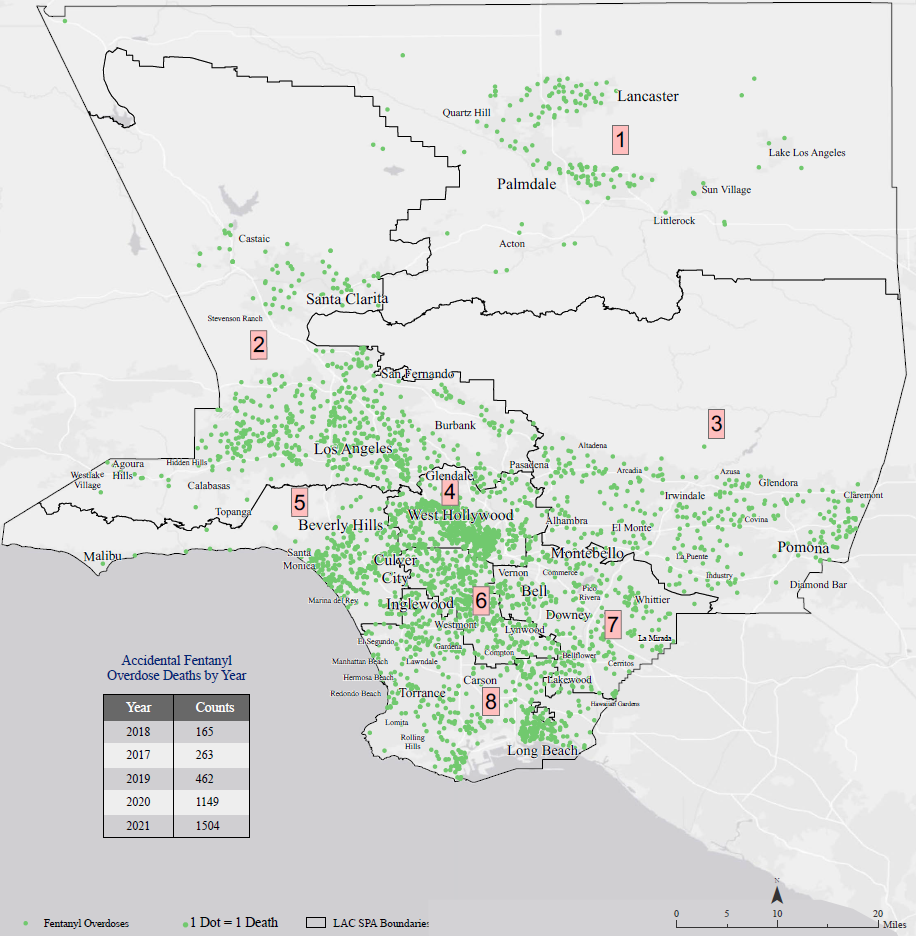
The number of fentanyl overdose deaths in LAC has been increasing every year since routine testing of fentanyl began in May 2016. In 2021, fentanyl overdose deaths increased to 1,504, nearly reaching meth overdose deaths (n=1,526) after jumping 1,280% from 2016, and jumping 31% from 2020.
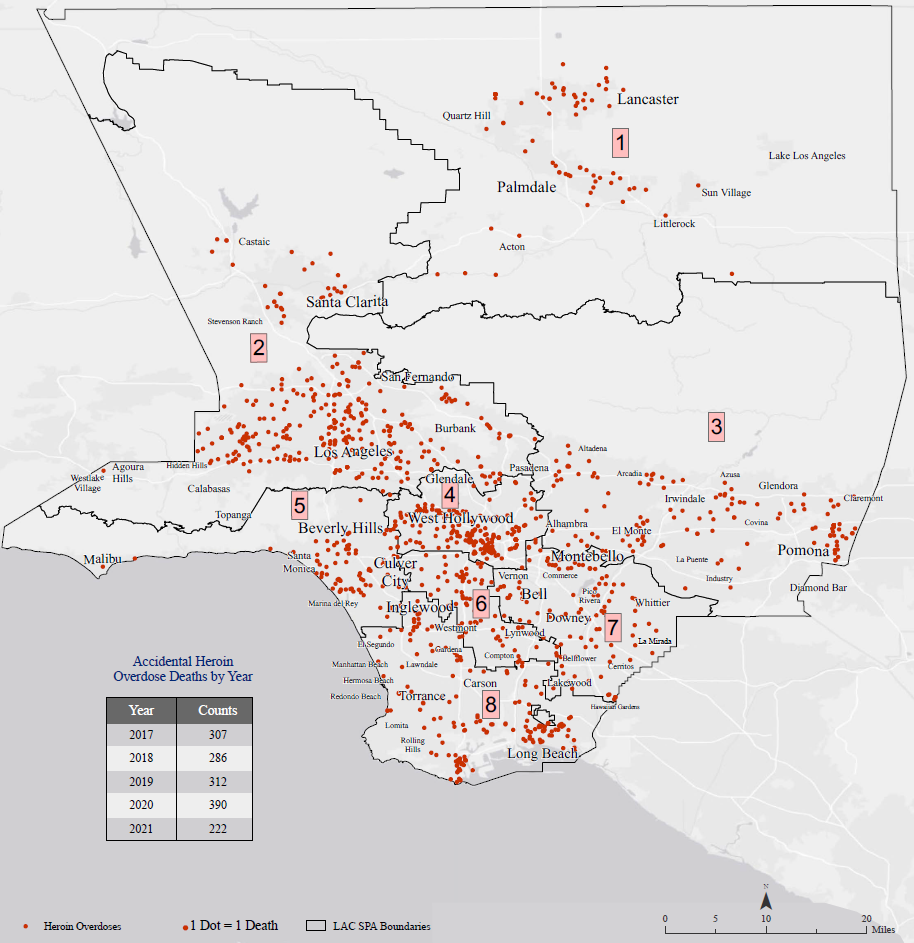
Heroin deaths decreased by 43% from 390 in 2020 to 222 in 2021.
From 2010 to 2021, opioids were involved in over half of all alcohol and drug (AOD) accidental overdose deaths (ranging annually from 46% to 63%).
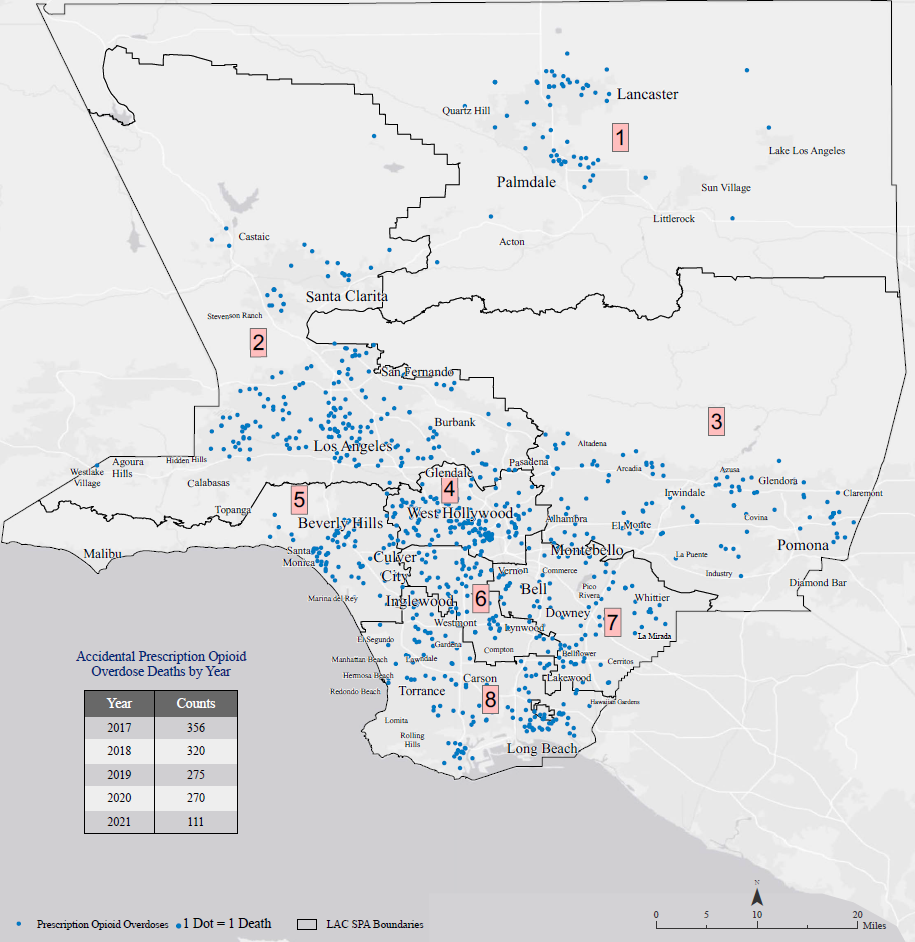
In 2010, 54% and 28% of AOD deaths involved Rx opioids and heroin, respectively. Over time, the involvement of heroin and Rx opioid in overdose deaths decreased, and were identified in less than 10% of AOD deaths in 2021.
In contrast, fentanyl-related overdose deaths greatly increased, from accounting for only 2.7% (rate=0.2 per 100,00 population) in 2010, to over half (54.9%; rate=15.1) of all AOD deaths in 2021 (Figure 5).
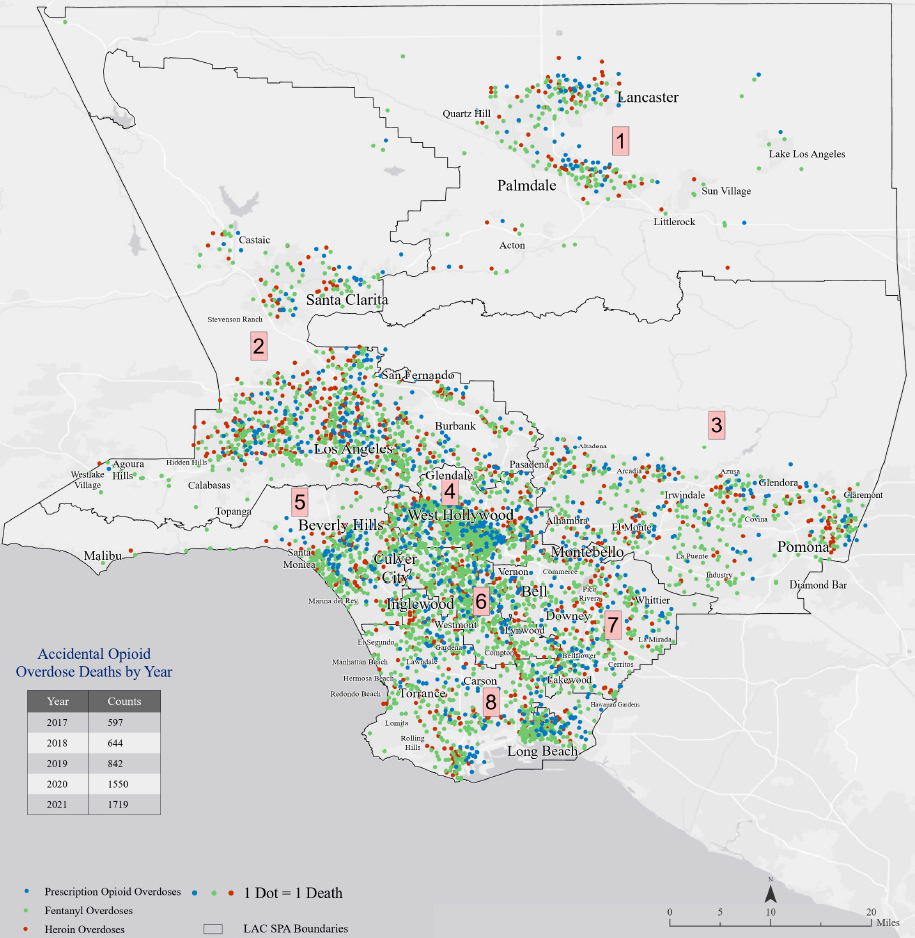
According to LAC Coroner’s data, opioid overdose deaths were highest in the Metro region (SPA 4), and lowest in the Antelope Valley (SPA 1) region. Fentanyl overdose deaths were also highest in the Metro and Antelope Valley regions, while heroin and Rx opioid overdose deaths were highest in the San Fernando region (SPA 2), and lowest in Antelope Valley region (Figure 6).
Instructions: Hover over map to display drug name, and click on map to enlarge image.
Figure 6. Opioid, fentanyl, prescription opioid, and heroin overdose deaths, by SPA, LAC, 2017-2021
Source: LAC Coroner
Notes:
1 Dot = 1 death
Blue dots = Prescription Opioid Overdoses
Green dots = Fentanyl Overdoses
Red dots = Heroin Overdoses
Figures 1-3. Centers for Disease Control and Prevention, National Center for Health Statistics. National Vital Statistics System, Mortality 1999-2020 and 2018-2021 on CDC WONDER Online Database, released in 2023. Data are from the Multiple Cause of Death Files, 1999-2020 and 2018-2021, as compiled from data provided by the 57 vital statistics jurisdictions through the Vital Statistics Cooperative Program. Accessed at http://wonder.cdc.gov/mcd-icd10-expanded.html on Aug 3, 2023.
Figures 4-6. Los Angeles County Medical Examiner/Coroner’s Office. Coroner and Toxicology data. Data as of May 2022.