Availability
Meth Seizures
Meth is the most common drug identified from seizures in LAC, and it is increasing
Figure 1. Drugs identified from law enforcement items submitted to forensic labs, LAC
Source: NDEWS
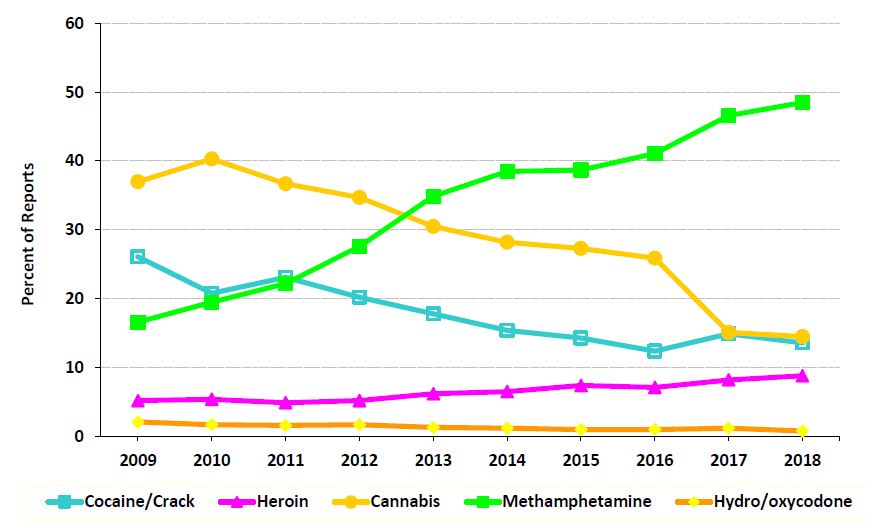
- Since 2013, methamphetamine has been the most commonly identified drug from law enforcement seizures in Los Angeles County (LAC).
- In 2017, of the 27,875 items seized by law enforcement in LAC, nearly half (46.8%) of them were identified as methamphetamine (NDEWS, 2018).
- In 2018, methamphetamine accounted for 48.5% of all NFLIS reports of seized items. This increasing trend has continued for more than a decade (NDEWS, 2019) (Figure 1).
Trafficking
Most of the meth in the US is produced clandestinely in Mexico
- Methamphetamine is available throughout the U.S. and is most prevalent in the West, Midwest and Southeast regions. It is indicated as high availability throughout the U.S. by Drug Enforcement Administration (DEA) Field Divisions. Most of the methamphetamine available in the United States is now produced in Mexico (NDTA, 2020).
- Mexican methamphetamine continues to be the major low cost, high purity, high potency alternative to domestic production (NDTA, 2020).
- Mexican Transnational Crime Organizations (TCOs) continue to adapt to new restrictions on chemical precursors of methamphetamine (e.g., pseudoephedrine), such as adopting alternative methods of manufacturing methods by using chemicals that are easier to obtain (e.g., Phenyl-2-propanone [P2P] from benzaldehyde and nitroethane) (NDTA, 2020).
Meth is mainly smuggled into the US across the Southwest Border (SWB)
- Total methamphetamine seizures in the US increased 77% from 41,396 kg to 73,351 kg from 2018-2019 (NDTA, 2020).
- In 2019, nearly all (93%) methamphetamine seizures in the US occurred at or near the Southwest Border (SWB) (NDTA, 2020).
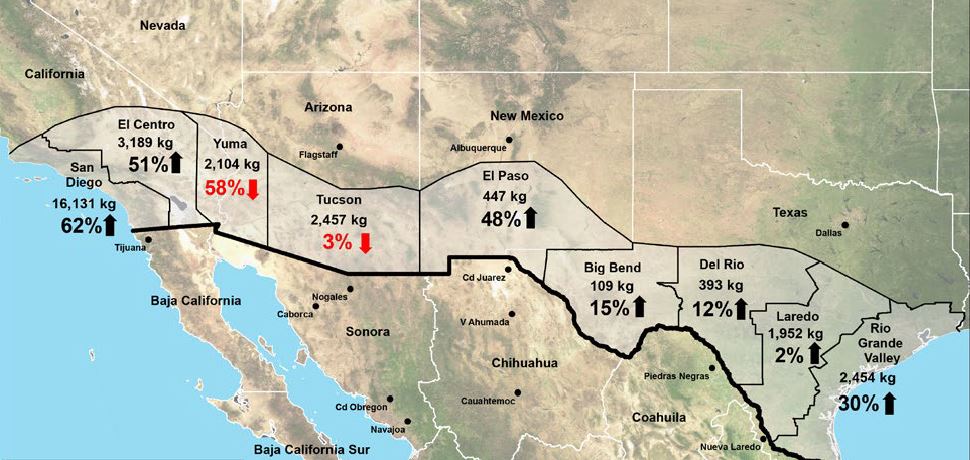
- Methamphetamine seizures along the SWB increased 523% from 10,969 kg in 2013 to 68,355 kg in 2019, and continues to increase (NDTA, 2020). The majority (54%) of methamphetamine seized along the SWB occurred in the San Diego corridor (NDTA, 2018) (Figure 2).
- Traffickers employ various techniques to conceal methamphetamine in forms such as crystals, paste, and liquids when smuggling with human couriers, parcel services, and commercial flights or buses (NDTA, 2020). Particularly common methods include transporting small multi-kilogram shipments of methamphetamine in privately owned vehicles by concealing in the vehicle's fuel tanks, tires, or other natural voids (NDTA, 2020).
- Meth conversion labs convert methamphetamine powder into crystal or recrystallize methamphetamine in solution for consumption.
- The majority of conversion laboratory seizures have occurred in California from 2000 to 2017 and 2019 (NDTA, 2020). In 2017, conversion laboratories seized in California accounted for 50% of all conversion laboratories seized nationwide (NDTA, 2018). In 2019, there were 7 methamphetamine conversion laboratory incidents reported from California (NDTA, 2020).
Figure 2. Methamphetamine seizures in 2017 and percent change from 2016-2017 at the Southwest Border Corridor by Customs and Border Protection, US
Source: NDTA
Domestic Production
- With Mexican methamphetamine dominating the black market, domestic production has greatly decreased.
Combat Meth Epidemic Act (CMEA) of 2005
- In 2005, the Combat Meth Epidemic Act was passed in the US to regulate over-the-counter sales of methamphetamine precursor chemicals (e.g., ephedrine, pseudoephedrine, phenylpropanolamine), and to regulate retail practices (e.g., daily and monthly purchase limits, sales logbooks, customer ID verification, employee training, product placement, certify sellers).
- Prior to 2005, clandestine meth labs were abundantly set up in a variety of places in the US, including private residences, motel and hotel rooms, apartments, house trailers, mobile homes, campgrounds, and commercial establishments.
- Clandestine meth labs peaked in 2004, with 23,703 reported methamphetamine laboratory incidents (NDTA, 2020).
Domestic meth production decreased after 2005
- Domestic methamphetamine production has been decreasing since 2004, rose moderately in 2010, then decreased consistently to its now lowest point since 2000 (NDTA, 2020).
- From 2004 to 2019, methamphetamine clandestine laboratory incidents (i.e., seizures of clandestine labs, equipment or chemicals only, discoveries of dumpsites) had decreased significantly by 96.2% from 23,703 to 890 (Figure 3).
- Despite the decreases in methamphetamine production in the US, methamphetamine remains the most frequently manufactured drug seized in clandestine laboratories in the US.
- In 2017, there were 223 methamphetamine clandestine laboratory incidents reported in California (NDTA, 2018).
- In 2019, 85% of all methamphetamine laboratories seized in the US were small laboratories capable of producing 2 ounces or less of methamphetamine per production cycle, making it small scale and easy to conceal (NDTA, 2020). Clandestine laboratories producing 20 pounds or more accounted for only 1% of all seized clandestine methamphetamine laboratories (NDTA, 2019).
Supply in the US
Meth remains widely available in the US, particularly the West
- In 2017, 45% of participating law enforcement agencies reported that methamphetamine would be easily obtained at any time in the US, indicating high availability of methamphetamine. The regions with the highest availability of methamphetamine were the Pacific (79%), West Central (72%) and Southwest (69%) regions (Figure 4). (NDTA, 2017)
- The Los Angeles Field Division has consistently reported high availability of methamphetamine (NDTA, 2019).
Figure 4. Percent of participating law enforcement agencies reporting high availability of methamphetamine by region
Source: NDTA
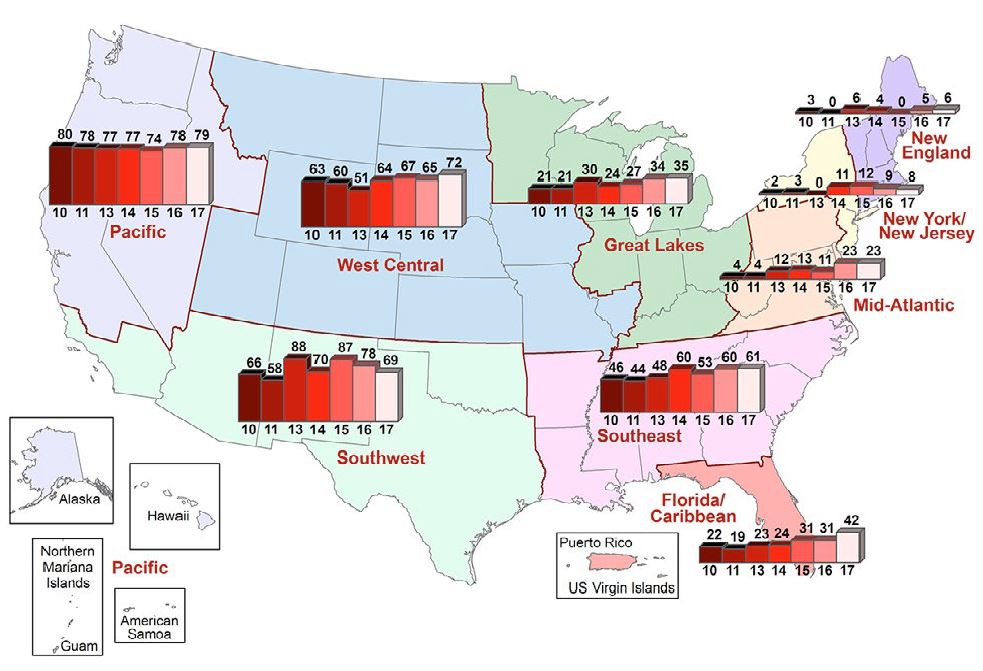
Note: Numbers on top of the bars over each region represent the percent of participating law enforcement agencies reporting high availability of methamphetamine in that region. Numbers below the bars represent the year.
Meth prices have been dropping, yet purity remains high
- From 2012 to 2017, average retail price per pure gram of methamphetamine for domestic purchases decreased 30.9% from $81 to $56 (Figure 5).
- The price of methamphetamine has been steadily decreasing, even as the purity of the products have stayed high (Figure 5), possibly due to the oversupply of methamphetamine in the U.S. market (NDTA, 2019).
- While methamphetamine is trafficked into the US in various forms (e.g. liquid suspensions, pills, powder, shards) for concealment, almost all of it has consistently been very pure at an average of over 90% in the past few years (Figure 5).
- Any form of methamphetamine (powder, liquid, shard) that is 80% or higher in purity is known as crystal meth, whereas any form that is less than 80% pure is known as meth (DEA, 2019).
- During the COVID-19 pandemic, the TCOs intended to swindle customers by holding shipments of methamphetamine so to raise its price as the supplies in the U.S. were diminishing.
Meth as a Drug Threat
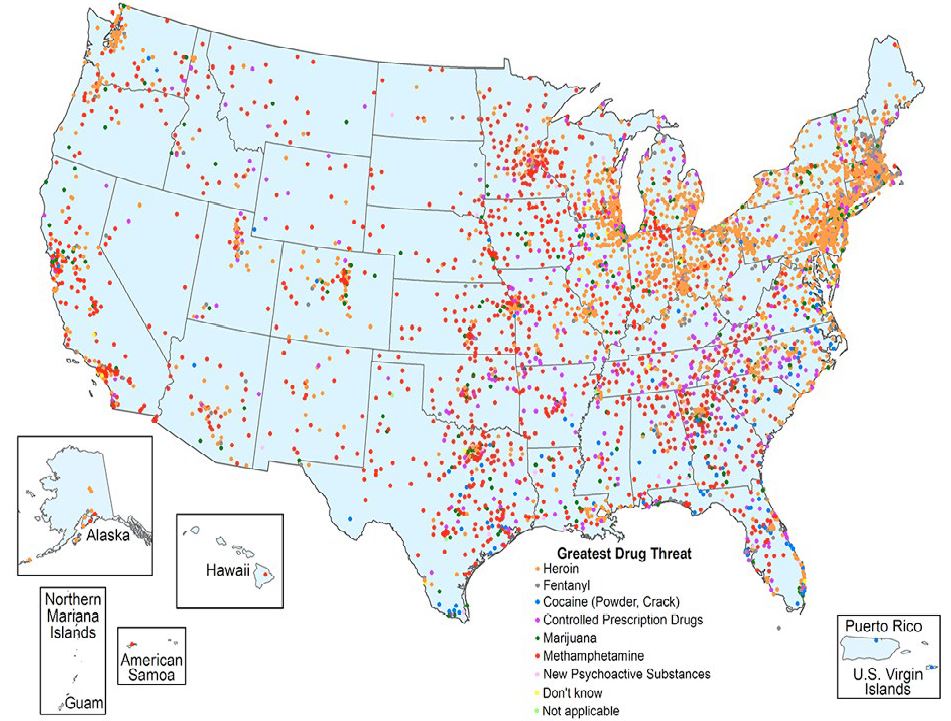
Meth remains the greatest drug threat in the West
- In 2017, law enforcement agencies reported that methamphetamine continues to be the greatest drug threat (Figure 6). Methamphetamine is a high and stable threat, as it is the drug that most contributes to violent crimes (36.3%), and contributes the second most (after heroin, 38.5%) to property crimes (31.9%) (NDTA, 2017).
Figure 6. Greatest drug threat reported by law enforcement agencies, 2017
Source: NDTA
References
Drug Enforcement Administration (DEA). National Drug Threat Assessment (NDTA). 2017-2020.
Drug Enforcement Administration (DEA). Methamphetamine Seizures Continue to Climb in the Midwest. July 10, 2019. https://www.dea.gov/stories/2019/07/10/methamphetamine-seizures-continue-climb-midwest
National Drug Early Warning System (NDEWS). Sentinel Community Site Profile: Los Angeles County. 2015-2020.