
In the US, the number of drug overdose deaths has been increasing dramatically over the last two decades. The number of drug overdose deaths in 2021 was nearly 5 times that in 1999. Since 2009, drug overdoses has been the leading cause of injury deaths, surpassing the number of deaths by both motor vehicle crashes and firearms. It’s widely recognized that opioids were driving the national drug overdose epidemic with consistent increases in opioid overdose deaths, and particularly sharp increases in the last couple of years. In the US, opioid overdose deaths increased 61% from 2019 to 2021, and increased 17% from 2020 to 2021 (Figure 1).
In Los Angeles County (LAC), increases in drug overdose deaths in LAC were observed starting in 2015, and were also particularly steep in the last couple of years (Figure 1). Compared to 2021, opioid overdose deaths increased by 125% from 2019, and by 20% from 2020 (Figure 1).
(Note: Based on death certificate data. For local opioid- and fentanyl-related death data from the Coroner’s Office, please see Figures 4-6).
In the US, the rise in opioid overdose deaths can be outlined in three distinct waves (Figures 2-3):
California followed a similar pattern as the overall US with a slight lag. In LAC, the number of synthetic opioid deaths sharply increased from 2015 through 2021, driving the increase in opioid deaths (Figures 2-3).
According to LAC Coroner’s data, opioid deaths were relatively stable from 2010-2015, then began increasing in 2016. By 2022, there were 2,072 opioid deaths, an 8% increase from the previous year, and a 146% increase from 2019.
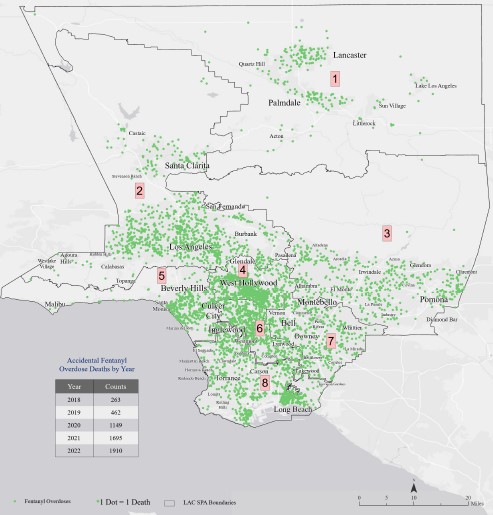
The number of fentanyl overdose deaths in LAC has been increasing every year since routine testing of fentanyl began in May 2016. In 2022, fentanyl overdose deaths increased to 1,910, surpassing meth overdose deaths (n=1,882). Fentanyl overdose deaths increased by 13% from the previous year, and has jumped by 1,652% since 2016.
Heroin deaths decreased 46% from 390 in 2020 to 211 in 2022 (Figure 4).
In 2010-2022, opioids were involved in over half of all alcohol and drug (AOD) accidental overdose deaths (ranging annually from 46% to 64%).
In 2010, 54% and 28% of AOD deaths involved Rx opioids (excluding fentanyl only) and heroin, respectively. Over time, the involvement of heroin and Rx opioid in overdose deaths decreased, and were identified in less than 10% of AOD deaths in 2021 and thereafter.
In contrast, fentanyl-related overdose deaths greatly increased, from accounting for only 2.7% (rate=0.2 per 100,000 population) in 2010, to over half (59.3%; rate=19.5) of all AOD deaths in 2022 (Figure 5).
In 2016-2022, opioid overdose deaths occurred most frequently among adults aged 26-34 years in LAC for all opioid types, except Rx opioids which was most common among adults aged 55-64 years (Figure 6).
Since 2016, adults aged 26-34 years have consistently had the highest number of deaths involving opioids. In 2022, opioid overdose deaths for overall opioids and fentanyl were highest among those aged 26-34, followed by adults aged 35-44 years, and 45-54 years (Figure 7).
In 2016-2022, males accounted for the majority (78%) of all opioid overdose deaths in LAC (Figure 8). The annual number of deaths among males increased 420% from 322 to 1,674, largely due to the increasing number of deaths involving fentanyl (Figure 9).
From 2016-2022, Whites accounted for about half of overdose deaths involving any opioid (48%), Rx opioids (58%), heroin (56%), and fentanyl (43%) in LAC (Figure 10). Throughout 2010-2022, there were consistently more opioid overdose deaths among Whites compared to Latinxs and Blacks (Figure 11).
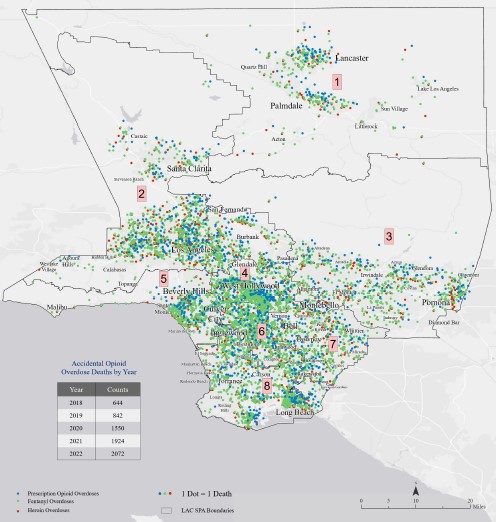
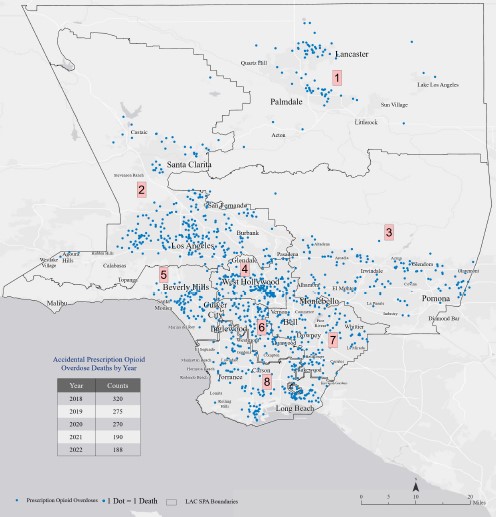
According to LAC Coroner’s data, opioid overdose deaths were highest in the Metro region (SPA 4), and lowest in the Antelope Valley (SPA 1) region. Fentanyl overdose deaths were also highest in the Metro region and lowest in the Antelope Valley region, while heroin and Rx opioid overdose deaths were highest in the San Fernando region (SPA 2), and lowest in Antelope Valley region (Figure 12).
Instructions: Hover over map to display drug name, and click on map to enlarge image.
Figure 12. Opioid, fentanyl, prescription opioid, and heroin overdose deaths, by SPA, LAC, 2018-2022
Source: LAC Coroner
Notes:
1 Dot = 1 death
Blue dots = Prescription Opioid Overdoses
Green dots = Fentanyl Overdoses
Red dots = Heroin Overdoses
Figures 1-3. Centers for Disease Control and Prevention, National Center for Health Statistics. National Vital Statistics System, Mortality 1999-2020 and 2018-2021 on CDC WONDER Online Database, released in 2023. Data are from the Multiple Cause of Death Files, 1999-2020 and 2018-2021, as compiled from data provided by the 57 vital statistics jurisdictions through the Vital Statistics Cooperative Program. Accessed at http://wonder.cdc.gov/mcd-icd10-expanded.html on Aug 3, 2023.
Figures 4-6. Los Angeles County Medical Examiner/Coroner’s Office. Coroner and Toxicology data. Data as of November 2023.