- Any Mention All Opioids
- Any Mention Heroin
- Any Mention Rx Opioids
- Any Mention Natural/Semi-synthetic
- Any Mention Synthetic
- Any Mention Fentanyl
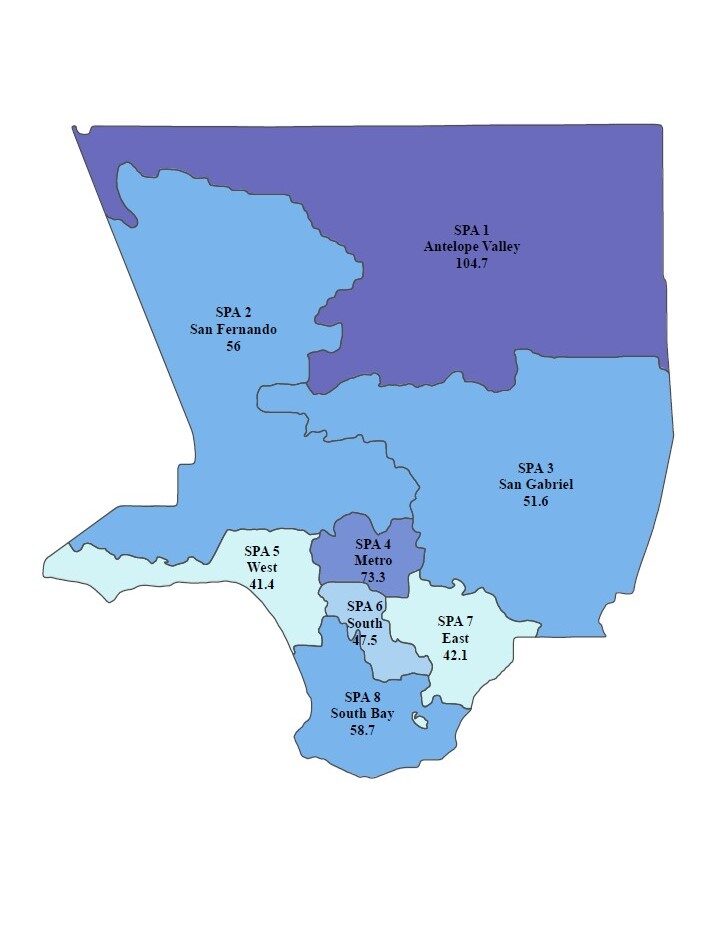
- Primary All Opioids
- Primary Heroin
- Primary Rx Opioids
- Primary Natural/Semi-synthetic
- Primary Synthetic
- Primary Fentanyl
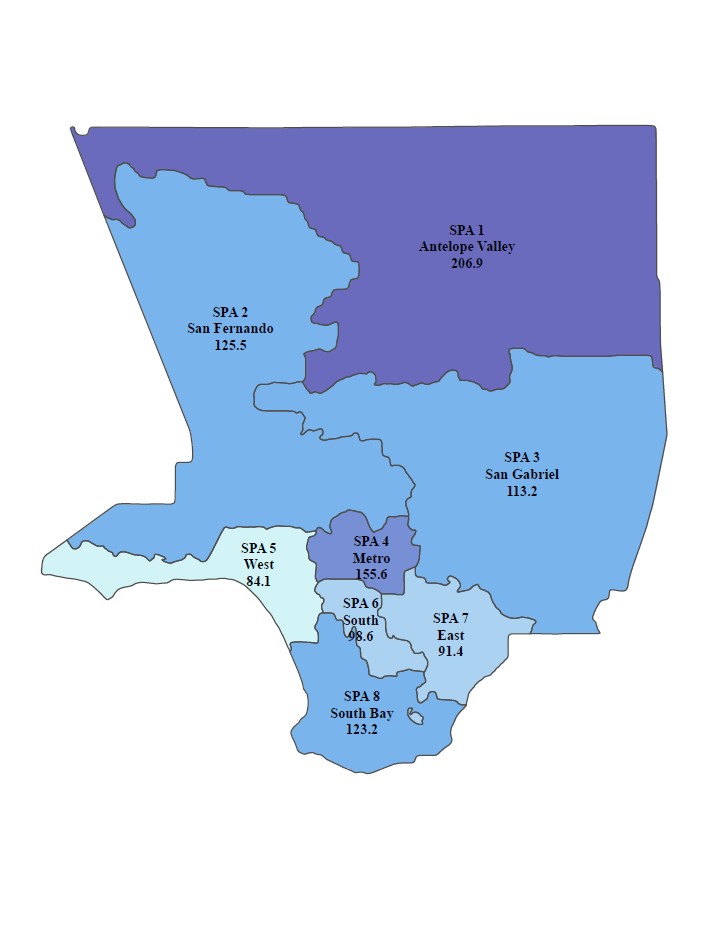
Any Mention All Opioids
- Primary All Opioids
- Primary Heroin
- Primary Rx Opioids
- Primary Natural/Semi-synthetic
- Primary Synthetic
- Primary Fentanyl
- Any Mention All Opioids
- Any Mention Heroin
- Any Mention Rx Opioids
- Any Mention Natural/Semi-synthetic
- Any Mention Synthetic
- Any Mention Fentanyl