Methamphetamine
Los Angeles County
Supervisorial Districts (SD)
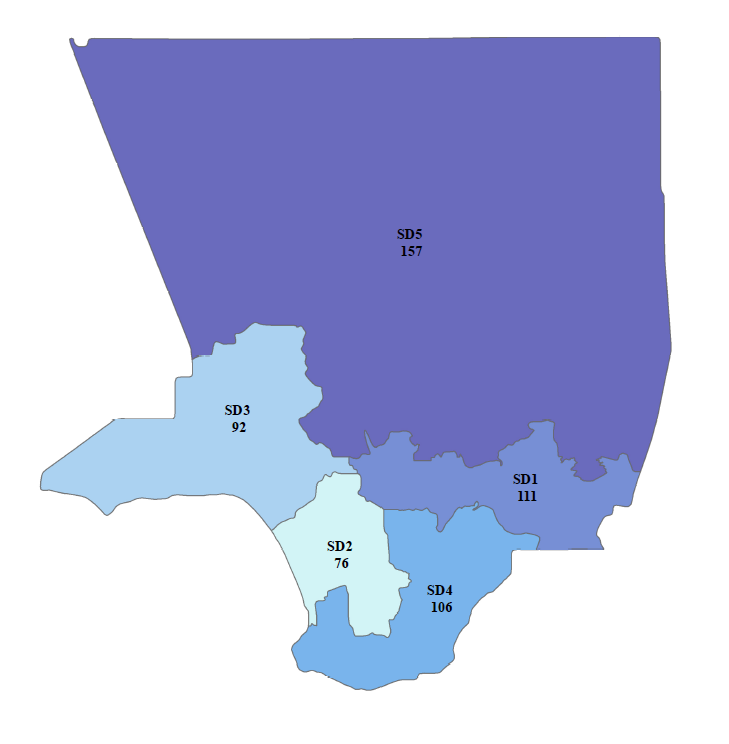
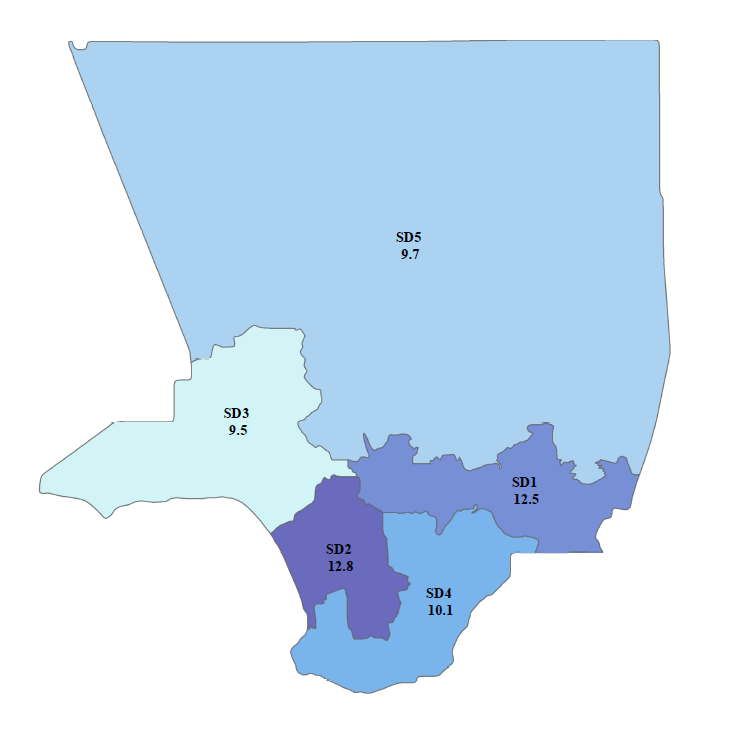
Meth DUI
Figure 2. Methamphetamine-involved fatal collisions by SD, LAC, 2001-2021
Source: FARS
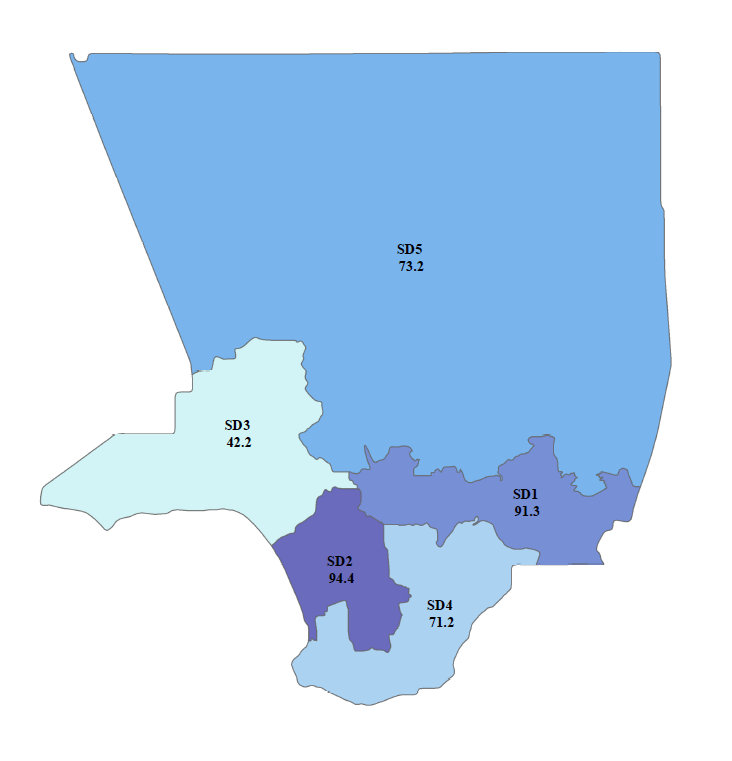
Meth ED Visits
Figure 4. Methamphetamine-related ED visits, by SD, LAC, 2021
Source: HCAI
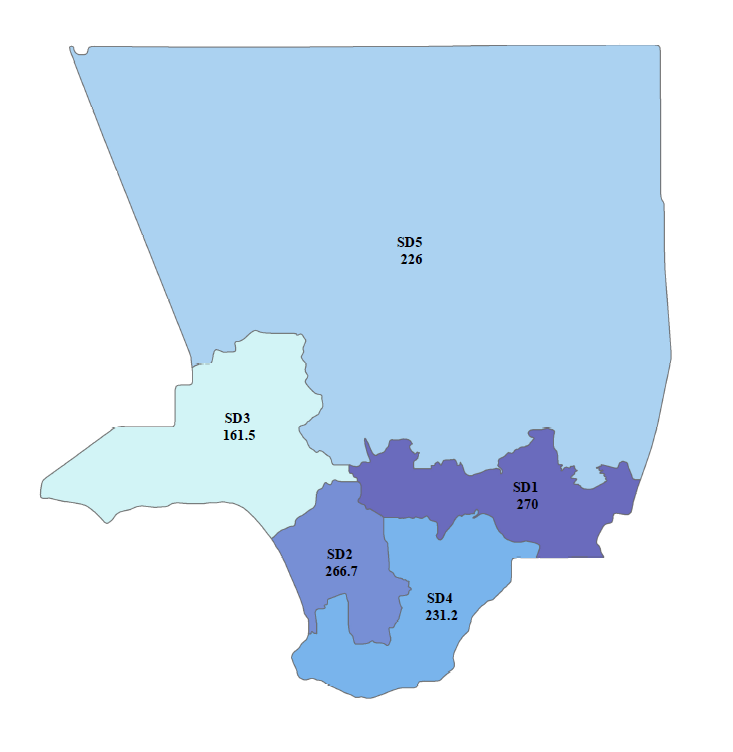
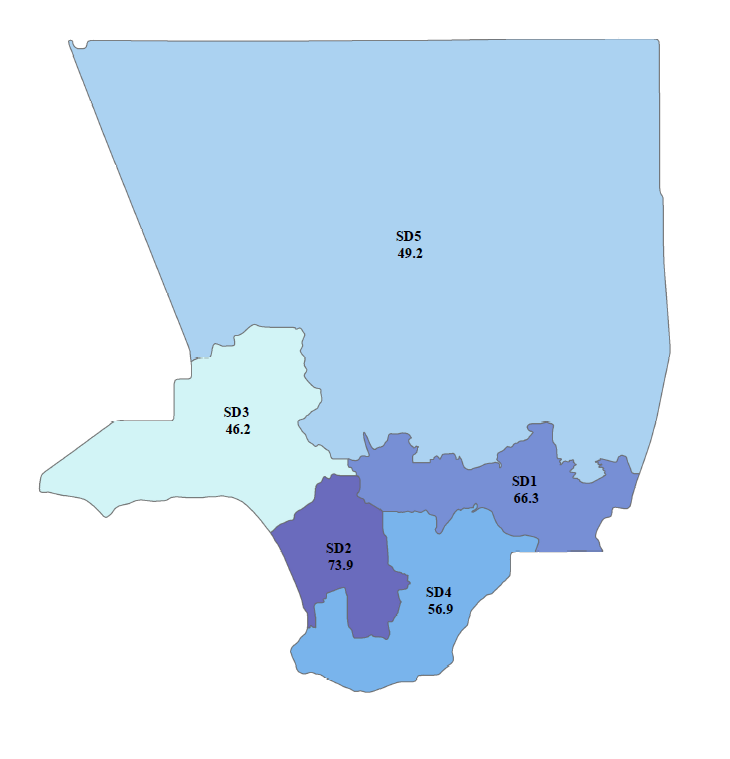
Figure 6. Primary methamphetamine ED visits, by SD, LAC, 2021
Source: HCAI
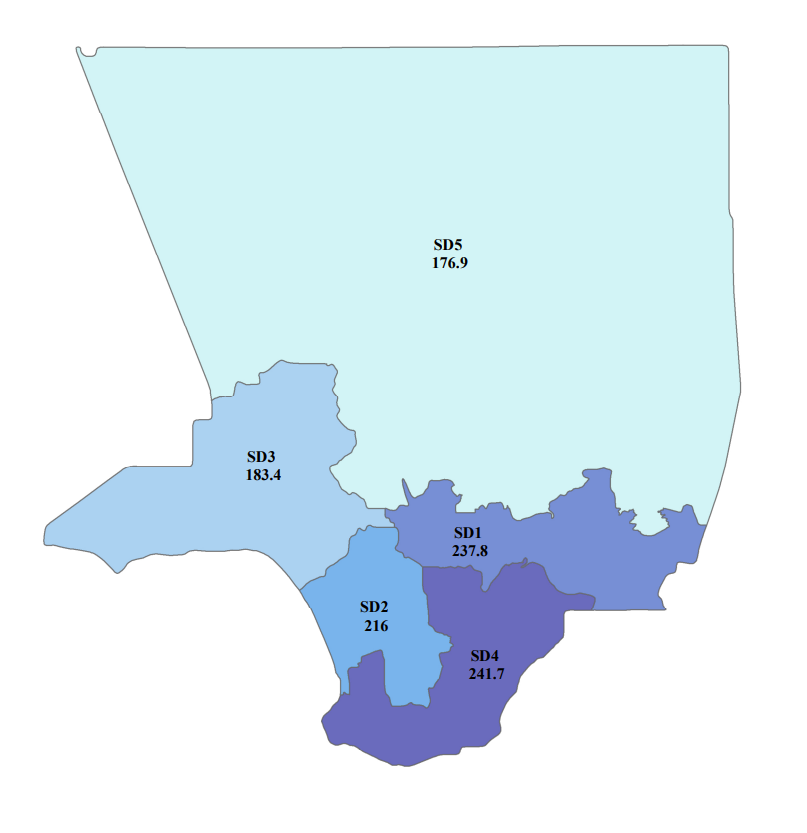
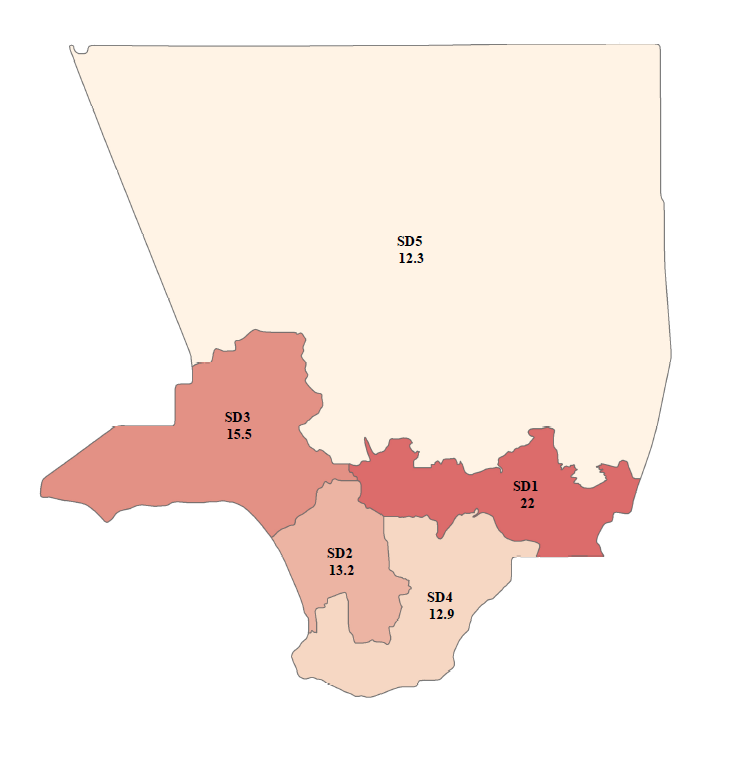
Meth Deaths
Figure 27. Methamphetamine overdose death rates per 100,000 population, by SD, LAC, 2021
Source: LAC Coroner
Meth Treatment
Figure 36. Primary methamphetamine treatment admission rates per 100,000 population, by SD, LAC, FY2122
Source: LACPRS
References
National Highway Traffic Safety Administration (NHTSA) Fatality Analysis Reporting System (FARS). Data sets 2001-2021.
California’s Department of Health Care Access and Information (HCAI, formally OSHPD). Data sets 2005-2021.
Los Angeles County Medical Examiner/Coroner’s Office. Coroner and Toxicology data. Data as of May 2022.
Los Angeles County Participant Reporting System (LACPRS). California Outcomes Measure System data.
See methamphetamine data for specific regions in Los Angeles County:

Service Planning Area
Dashboard